An introduction to the water structure problem
Although the macroscopic properties of water have been heavily studied, there are things we don’t understand about this ubiquitous substance. In this post, I will provide an introduction to the problem of describing water’s structure. At first glance, the idea of a liquid having structure seems preposterous. Indeed, liquids cannot maintain a structural arrangement of atoms like solids can. Instead, the atoms/molecules tumble past each other in constant state of motion. This allows for the defining property of the liquid state – the ability to fill a container.
However, one can talk about an average local structure in the following sense – if you were to sit on a water molecule’s oxygen atom and observe where other molecules are around you, over time you would notice that the nearest neighboring molecules tend to be in certain places. This average structure can be quantified in a radial distribution function, which shows the likelihood of observing other atoms at different distances r from a central atom:
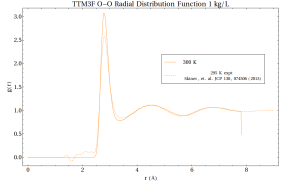
If the positions of atoms are completely random, then the RDF equals to 1. Where it is greater than 1, that indicates an average excess of molecules at that distance, and where it is less than 1 indicates a deficit. Note that by this measure, structure does not extend that far out – only 10 Angstroms (1 nanometer) at most. Looking at RDFs is by no means the end of the story, as we will see. For one thing, rdfs are spherically averaged. To get a more complete picture one can also make 3D plots. For instance, at the distance of r = 2.8 Angstroms:
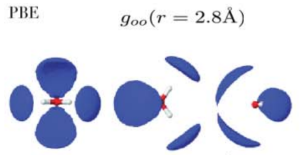
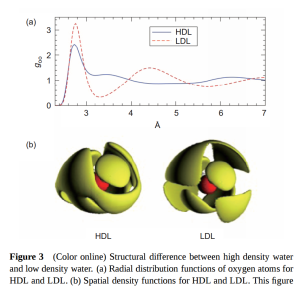
This plot was obtained from quantum-mechanical simulations performed a previous grad student in our group, Jue Wang. In addition to doing the spherical averaging, RDFs do not tell us if the local structure varies through the liquid. For instance, there might be regions where each molecule has more hydrogen bonds on average, (more “ice-like”) which would cause the water in that region to have a lower density. Correspondingly, there might be regions where molecules have less hydrogen bonds, and more ‘interstitial’ molecules, which would cause a higher density. The idea that water may be inhomogeneous goes back to 1892, when W.K. Roentgen proposed that water contains a mixture of two structural motifs – “ice like” and “liquid like”. The idea helps explain many of the anomolies of water, such as the fact that water has a density maximum at 4 C. If you cool water below 4 C, it expands, which is highly anomalous. This could be explained though if the low density regions start to dominate below 4C.
what does the phase diagram of deeply supercooled water look like?
_ The debate about water structure dovetails with a debate about the low-temperature behaviour of water.
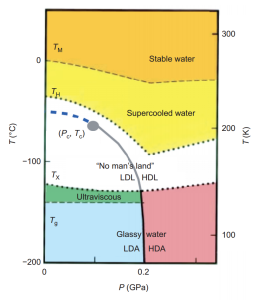
Water can be easily supercooled down to -20 C. However around -45 C one runs into a hard limit, and water always freezes. There is much interest, however, in how about how water would behave if it could be supercooled even lower. This hypothetical part of the diagram is called the ‘no-mans land’.
Interestingly, it is possible to create amorphous ice (sometimes also called glassy water). One way to do this is to cool water at an extremely rapid rate. If the cooling is done quickly enough, the water molecules don’t have time to freeze into ice, and they are trapped in a ‘glass’ which is technically a supercooled liquid state, but so cold that it behaves like a solid. Another way of making amorphous ice is by putting normal ice under high pressure.
At different pressures amorphous ice exists in two forms, low density (LDA) and high density (HDA), with a sharp phase transition between them. The video above shows what happens when you remove the pressure on HDA — it quickly converts to LDA.
Now, you might think you could make supercooled water in the ‘no-mans land’ part of the phase diagram by heating up amorphous ice. Unfortunately, if you do this it turns into regular ice, because at higher temperatures the water molecules can move around more and adopt their preferred form.
There is a great debate in the scientific community about what the “phase” diagram is in the ‘no-mans land’. The term “phase” here is technically incorrect, because supercooled water is not a true thermodynamic phase, rather it is a metastable state. In any case, in a seminal 1992 Nature paper it was proposed that at some point in the no-mans land there is a second order critical point.
To understand what a 2nd order critical point is and why this would be important for room temperature water, consider the phase diagram of water shown in Chemistry 101 and Physics 101 textbooks:
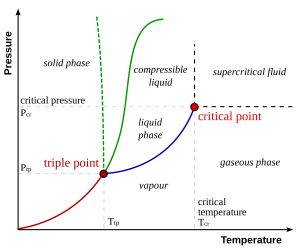
Now let’s flip it and rotate it that pressure is on the x-axis and temperature is on the y-axis, so we can compare to our previous diagram:
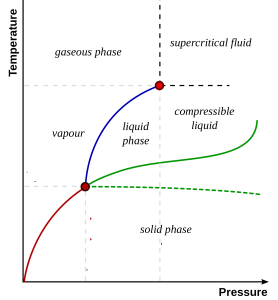
The blue line shows the transition between liquid and gas. The red point at the top of this line is an example of a 2nd order critical point. Above this point, there is no sharp distinction between liquid and gas. Water above the critical point is called ‘supercritical’. In super-critical water there are very large density fluctuations (inhomogeneities!).
Similarly, if a 2nd order critical point exists in the no-mans land between LDA and HDA, then liquid water should contain density fluctuations between HDL (high density liquid) and LDL (low density liquid).
Another diagram has been purposed though, called the ‘singularity free‘ version, and there is great debate about how to prove which picture is correct currently raging in the scientific community, which I don’t have space to go into here. Many scientists like the concept of a critical point in the no-mans land, though, because it helps explain many strange anomalies observed in studies of supercooled water. Many of the properties of supercooled water, such as its compressibility, anomalously start to increase when water is supercooled and follow a trajectory that would lead to a singularity if a low enough temperature could be reached.
Is room temperature water homogeneous or inhomogeneous?
During the 80’s and 90’s there was also intense debate between experimentalists about how many H-bonds water molecules have. By the early 2000’s, most scientists had reached a consensus that the average number was around 3.5, that the H-bond network filled all of space and was mostly tetrahedral, and that density inhomogeneities were small at room temperature. A 2004 x-ray scattering experimentalists challenged this view by proposing that water contains many molecules with only 2 hydrogen bonds which are connected in long chains. This was debated for some time and is now largely believed to be ill-founded.
A greater challenge, still being discussed today, came with the publication of “The inhomogeneous structure of water at ambient conditions” by Huang, Nilsson, et al. in 2009. Their argument largely rests on their interpretation of small angle X-ray scattering (SAXS) data, which probes changes at long wavelengths, on the order of nanometers. They find that at long wavelengths there is an unexpected increase in the scattering of x-rays. The authors tried to reproduce this result by doing a molecular dynamics simulation and were unable to. Their implication was that molecular dynamics simulations can not be trusted to settle the debate about the structure of water. However, such things from simulation is very computationally expensive. Later simulations by Sedlmeier, Horinek, and Netz that used a better calculation method did recover the excess response.
What molecular dynamics simulations show
Molecular dynamics simulations with the most optimized models (which have names like TIP4P/2005f) do show the co-existence of clearly defined HDL-like and LDL-like domains at very low temperature. For instance, Overduin and Patey simulated at the chilly temperature of 175 K, in a long box rectangular box with dimensions 12nm x 3 x 3nm:
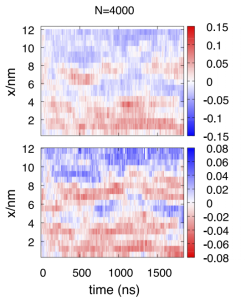
The top panel shows where molecules identified as “ice-like” are, in red. The bottom panel shows differences in density, with regions with lower density than average (ice-like) also shown in red. The x-axis represents time. Notice that there is switching between the two types of local structure with a timescale on the order of microseconds (1000 nanoseconds). Such switching back and forth was observed in other simulation work that simulated a smaller box of supercooled water for several microseconds.
While this is neat, simulations do not show any such heterogeneity in room temperature water.(ref) However, one can look at the distribution of the parameter Q4, which measures tetrahedrality around each molecule. If the nearest neighbors were like they are in ice (nearly perfectly tetrahedral) then Q4=1. If they are random, Q4=0. There is a distribution of Q4 found in room temperature water with a peak around 0.8. Sedlmeier, el al. found that correlations in Q4 do not extend beyond 6 Angstroms, or the 2nd H-bonding shell.
If not nanometer scale heterogeneity, then could cause the excess x-ray scattering Huang et al observed? In a 2010 article in PNAS, it was suggested that normal stochastic density fluctuations can also explore the data. In my view neither this picture or the idealized picture of HDL/LDL domains are fully satisfying explanations. Both effects may be at play.
The current view that is most consistent with the experimental data is that room temperature water contains a hydrogen bond network that extends through all of space which is severely distorted in places, and may contain local inhomogeneites. Overall the network has a largely tetrahedral character with a most molecules having 3 or 4 hydrogen bonds (avg 3.5-3.9). Our Nature Communications paper shows how optical phonons propagate through this network. This type of overall homogeneity does not preclude the existence what we have called ‘polar nanoregions‘. This is because polar ordering has more to do with the relative orientations of the hydrogen atoms while structural ordering has more to do with the position of oxygen atoms.
The extent and nature of inhomogeneites in room temperature water remains controversial. A Dec. 2015 Nature Communications review by Nilsson & Pettersson in Nature Communications defends the validity of the two-state approach to understanding water several lines of experimental evidence, but controversially invokes a picture of HDL/LDL domains even at room temperature.
The accuracy of MD simulations can always be called into question, but no present day experiment can resolve the controversy about the structure of room temperature water, simply because there is no microscope that allows us to see structure as it extends over nanometers. Our recent work, discussed in my previous post, opens a new window into probing the local structure of water through the analysis of dielectric spectra, which we believe can bring more clarity to how water’s local structure changes with temperature.